Vivado Simulator scripted flow Part 1: Basic CLI usage
Series on Vivado Simulator Scripted Flow (Bash, Makefiles) ⌗
- Part I - you’re reading it
- Part II - Introduction to Bash scripting with Vivado tools
- Part III - Vivado Simulator flow using Makefiles
- Part IV - IP core and Block Design integration into scripted flow (coming soon)
Long Live CLI ⌗
If you’re reading this post, you are likely frustrated with with the Xilinx Vivado GUI. You probably feel that the interface is slow, and the number of windows and menus that must be navigated even for the most basic tasks is ridiculous. Worry not - you’re not alone. In the following series of guides, I will give you all the information you need to quickly move your simulation out of the graphical Vivado project into a scripted flow for easy compilation, elaboration, and simulation, all done using the Command Line Interface (CLI). In Part I, we will get familiar with using the Vivado CLI tools.
Note: This guide uses SystemVerilog as the language of choice, but everything discussed here is applicable to VHDL and Verilog too. In Part II, an example VHDL module is also included.
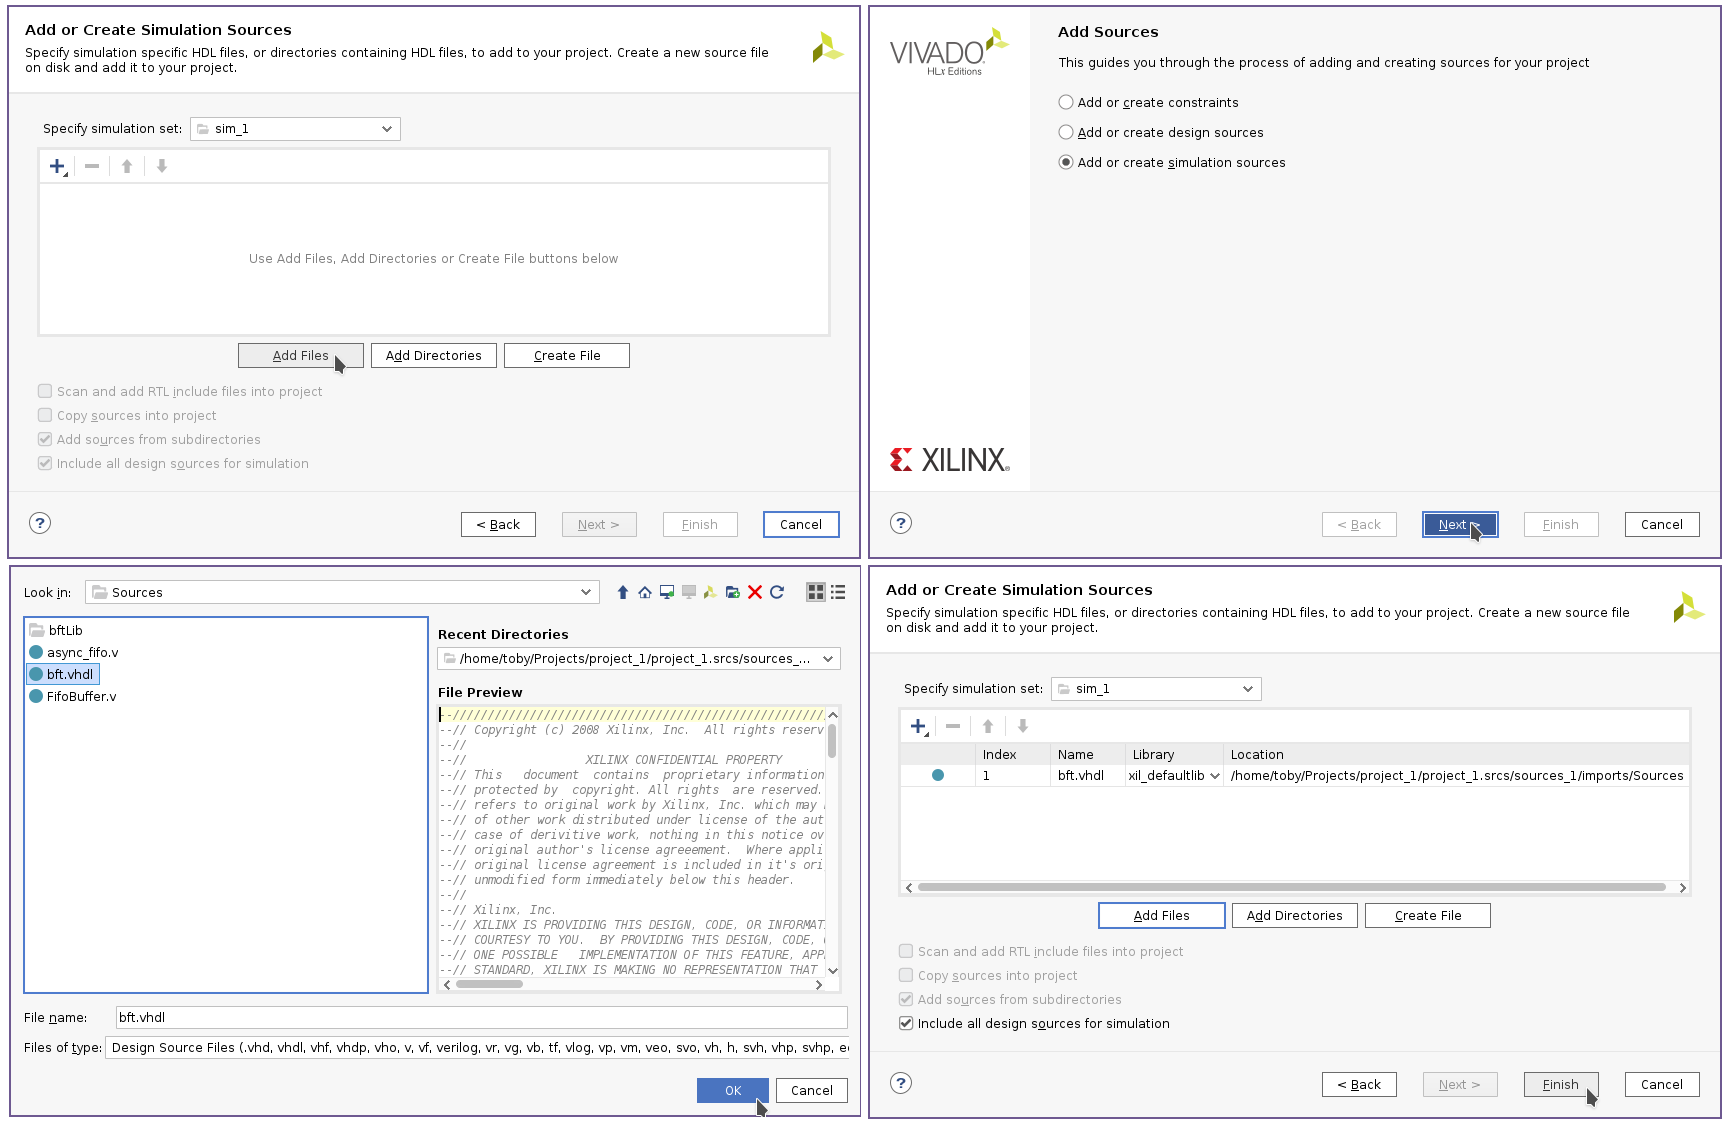 Fig. 1: That's a lot of pixels just to add a source file
Why bother? ⌗
If you’ve used the Vivado GUI (and, I mean, surely you must have if you’re reading this) then you know how clunky the graphical interface is. In stark contrast, compiling, elaborating and simulating from the command line has some serious advantages:
- Quick and easy addition/removal of sources
Unlike the disaster that’s demonstrated in Figure 1, once you have your simulation flow and sources down in a bash script or a makefile, you can quickly modify said list with any text editor without having to use any sluggish GUI’s.
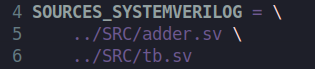 Fig. 2: Changing the source list is quick with any text editor
- Quick parameter / configuration adjustment
Just like modifying the sources, customizing various parameters of Vivado CLI tools (xvlog, xvhdl, xelab and xsim), adding plusargs, defines, etc. is much faster once you have a basic CLI flow set up - no more digging through various project setting menus just to find that one option you’re looking for.
 Fig. 3: Multiple `defines declared in some bash variables
- Integration with other tools
If you’re doing cosimulation with some C/C++ based software models, or compiling source code to create a binary for a CPU core you’re simulating, chances are you are using an external compiler like GCC, CLANG, or something more exotic. Running your simulation using scripts or makefiles means that you can easily add any prerequisite steps into your simulation flow, which allows you to keep everything consolidated in one place.
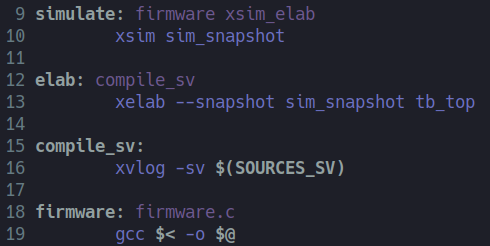 Fig. 4: This Makefile example compiles, elaborates the HDL sources and builds the firmware before running simulation
- Fast remote access
Have you ever tried running Vivado via X11 forwarding? Or maybe you use VNC? Perhaps RDP? Have you ever attempted to do this over a mobile connection? If you did, then you are likely well aware that running any sort of GUI forwarding over a cellular broadband makes ideal nightmare fuel.
In contrast, once you have a CLI flow, all you need is SSH, which will run respectably even on a dial-up connection based on a tin-can telephone infrastructure.
 Fig. 4: Latest developments in tin-can technology research
Drawbacks ⌗
There are some negative aspects of running Vivado Sim via CLI. I haven’t encountered any insurmountable roadblocks, but some things do take extra effort to get right, notably:
- Block Designs
You will need to find the autogenerated block design netlist somewhere in your project folders and copy it out. If you change the block design in the GUI, then you’ll have to do it again. Tough luck.
- Using IP
Same as above applies here, except unlike the block design netlist which is just one file, the generated IP or VIP (Verification IP) dependencies get strewn around in seemingly random and weirdly named folders that are hidden at the deepest ends of your Vivado project directory tree. find -iname "something.v" and grep -rnI "module_name" are invaluable here.
- Setting up
There’s no point in me trying to deceive you - the initial setup takes a while, especially if you have never used Xsim or other simulation tools from a terminal before.
A quick word on Vivado’s “Export Simulation” menu option ⌗
Sometimes it works and gives you a nice collection of all the sources + scripts required to run Vivado Simulator (or any other tool of your choice) from the command line. Sometimes it doesn’t due to Vivado failing to collect all the sources, or generating incorrect scripts. From my experience, I believe it highly depends on the version of the tools you are using, your operating system, what your nearest coworker had for breakfast this morning, and how the stars were aligned when you clicked the “export” button.
However, regardless whether the exported stuff runs correctly or fails, the export procedure can give you a good starting reference point by collecting most of the files that you’re interested in. Most.
Let’s do it! ⌗
Prerequisites ⌗
I will assume you have Xilinx Vivado installed and running on a Linux workstation. The examples given here could probably be made to work on cough other cough operating systems through some weird tools like Cygwin, Msys2, or WSL. Feel free to try and let me know if it works!
On my system, I’ve instaled the Xilinx tools at /opt/Xilinx, be sure to adjust this where necessary.
I will also assume you have some basic development tools installed on your system (make, git) and are reasonably familiar with using a terminal.
To add all the Vivado command line tools to your path you need to source the configuration script provided in the installation directory. This must be done every time you open up a new terminal.
source /opt/Xilinx/Vivado/2020.2/settings64.sh
What happens behind the GUI ⌗
The graphical interface of Vivado hides what’s really happening under the hood. Running a simulation is done in three steps:
1. Compilation ⌗
Compiling your Verilog, SystemVerilog, or VHDL sources is the first step. Compilation only looks at a single source file at a time - the compiler takes your HDL code, parses it, and converts it into… something. The result of the compilation step are object files that the simulator understands, but we don’t really care about the details here. What is important is that during this step, any syntax errors, missing symbols or includes, will result in a failure.
The basic syntax to compile sources from the command line is:
-
xvlog verilog_src.vfor Verilog sources -
xvlog -sv systemverilog_src.svfor SystemVerilog sources -
xvhdl vhdl_src.vhdlfor VHDL sources
2. Elaboration ⌗
During this step, the tool goes through the generated object files, collects information about the module hierarchy, and attempts to connect the modules as well as solve all hierarchical signal paths. This is the step where you get warnings about mismatched port widths, unused IO, or blocking assignments in sequential blocks (you really should consider sorting those out…). All of the tool’s hard work results in a simulation snapshot that you can pass to the simulator.
The basic syntax to elaborate your design from the command line is:
xelab -top name_of_the_top_module -snapshot new_sim_snapshot_name
3. Simulation ⌗
This step is straightforward:
xsim -snapshot new_sim_snapshot_name
We run xsim, which is our simulator, by passing the snapshot name as an argument, along with any other parameters we’d like set, such as plusargs, simulation run time, .tcl files to format the waves window (if we want to launch the gui), etc.
One small step for man, one big step for EDA ⌗
The best way to learn how to use Electronic Design Automation (EDA) tools it by using them, so lets explore the steps described in the previous section with a simple real world example - we’ll simulate a testbench with a single DUT.
Setup ⌗
Below is the source code for our device-under-test (DUT) that we’ll be using - an expertly crafted 32 bit adder IP core:
// adder.sv
// Module Description: superefficient ultraoptimized adder

module adder (
    input logic [31:0] a,
    input logic [31:0] b,
    output logic [31:0] sum
);

    always_comb begin
        sum = a + b;
    end

endmodule : adder
Next, a short little testbench to prove that the adder works correctly:
// tb.sv
// Module Description: testbench for the adder

module tb ();
    logic [31:0] a, b, sum;

    adder DUT(.*); //instantiate the amazing adder

    initial begin
    	a = 1;
    	b = 2;
    	#1;
    	assert (sum == 3) else // Unless something went really wrong in the universe, we'd expect that 1+2=3
    	    $fatal(1, "Well if we cant add 1 and 2 to get 3 then we really screwed something up");
    	$display("TB passed, adder ready to use in production");
    end
endmodule : tb
And lastly, the following directory tree is a good starting place for our simulation project:
-
work_dir/SRC<- Our sources go here -
work_dir/SRC/tb.sv<- This is our top level testbench -
work_dir/SRC/adder.sv<- This is our DUT -
work_dir/SIM/<- We will compile, elaborate, and simulate in here
You can also just download the entire project here: [.zip] [github]
Building and running ⌗
Once you’ve got the directory structure set up, browse to the SIM folder, open up a terminal, and source the Vivado configuration (don’t forget to adjust the path to match your installation location):
source /opt/Xilinx/Vivado/2020.2/settings64.sh
Then we can do step 1 of the flow, which is compilation of the sources. We run xvlog --sv <sources> to compile (remove the “-sv” to compile verilog, or replace xvlog with xvhdl for VHDL sources)
xvlog --sv ../SRC/adder.sv ../SRC/tb.sv
That should result in the following:
[work_dir/SIM]$ xvlog --sv ../SRC/adder.sv ../SRC/tb.sv
INFO: [VRFC 10-2263] Analyzing SystemVerilog file "<...>/work_dir/SRC/adder.sv" into library work
INFO: [VRFC 10-311] analyzing module adder
INFO: [VRFC 10-2263] Analyzing SystemVerilog file "<...>/work_dir/SRC/tb.sv" into library work
INFO: [VRFC 10-311] analyzing module tb
[work_dir/SIM]$
Next, we want to elaborate the compiled sources and create a simulation snapshot, so we call xelab:
xelab -debug typical -top tb -snapshot adder_tb_snapshot
Running the above command should result in a similar output to this:
[work_dir/SIM]$ xelab -top tb -snapshot adder_tb_snapshot
Vivado Simulator 2020.2
Copyright 1986-1999, 2001-2020 Xilinx, Inc. All Rights Reserved.
Running: /opt/Xilinx/Vivado/2020.2/bin/unwrapped/lnx64.o/xelab -top tb -snapshot adder_tb_snapshot
Multi-threading is on. Using 10 slave threads.
Starting static elaboration
Pass Through NonSizing Optimizer
Completed static elaboration
Starting simulation data flow analysis
Completed simulation data flow analysis
Time Resolution for simulation is 1ps
Compiling module work.adder
Compiling module work.tb
Built simulation snapshot adder_tb_snapshot
[work_dir/SIM]$
We’re almost there! All that’s left to do now is to launch the simulator and run the testbench, which we do by calling xsim with the following command:
xsim adder_tb_snapshot -R
Note: “-R” means “run the simulation until it finishes”, equivalent to run all when done from the graphic interface’s TCL shell.
If everything went correctly, you should see this:
[work_dir/SIM]$ xsim adder_tb_snapshot -R

****** xsim v2020.2 (64-bit)
  **** SW Build 3064766 on Wed Nov 18 09:12:47 MST 2020
  **** IP Build 3064653 on Wed Nov 18 14:17:31 MST 2020
    ** Copyright 1986-2020 Xilinx, Inc. All Rights Reserved.

source xsim.dir/adder_tb_snapshot/xsim_script.tcl
# xsim {adder_tb_snapshot} -autoloadwcfg -runall
Vivado Simulator 2020.2
Time resolution is 1 ps
run -all
TB passed, adder ready to use in production
exit
INFO: [Common 17-206] Exiting xsim at Wed Feb 10 22:04:44 2021...
[work_dir/SIM]$
The line “TB passed, adder ready to use in production” shows that our testbench completed successfully.
“But Norbert!,” you scream at me and point accusingly. “What if I want to look at some colourful waveforms?!”
We need to tell xsim to dump all of the waveform traces into the waveform database file (.wdb). To do this, we need to run some TCL commands to configure xsim after it launches.
Create a new file in the work_dir/SIM directory named xsim_cfg.tcl and paste the following contents into it:
log_wave -recursive *
run all
exit
Then, we need to re-run xsim, but with the -R parameter replaced as follows:
xsim adder_tb_snapshot --tclbatch xsim_cfg.tcl
Upon launch, xsim will source the xsim_cfg.tcl command file, which will configure xsim to log all the waves into the waveform database output file, run the simulation, and immediately exit after it’s done:
xsim adder_tb_snapshot --tclbatch xsim_cfg.tcl
xsim tb_snapshot -tclbatch xsim_cfg.tcl
<...>
source xsim_cfg.tcl
## log_wave -recursive *
## run all
$$$ TESTBENCH: Using VHDL subtractor
TB passed, adder and subtractor ready to use in production
## exit
<...>
Afterwards, you can just run xsim again like this:
xsim --gui adder_tb_snapshot.wdb
The --gui parameter tels xsim to start itself in the graphical interface mode, and the adder_tb_snapshot.wdb is the waveform database that is automatically generated by the xsim during simulation.
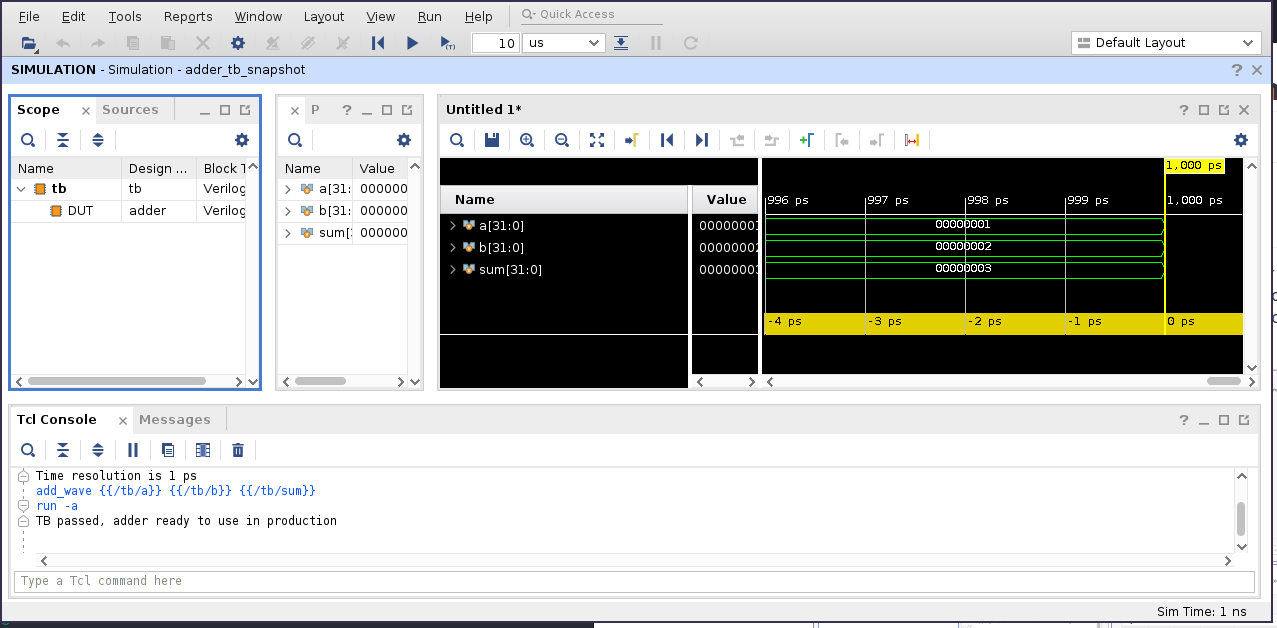 Fig. 5: Perfectly correct, just like all things should be
Conclusion ⌗
Now that you went through this guide, you have probably noticed how much more efficient this workflow is - once you have the commands down, adding additional sources or parameters is very quick and doesn’t require digging through confusing menus in the GUI.
But, it gets even better - if you put all of the commands in a Bash script, as well as make some small adjustments, you can run the entire flow with just one simple command, it’s almost like clicking the “Launch” button in the graphical interface! That’s what we’ll be discussing in Part II.
If you have any questions or observations regarding this guide ⌗
Feel free to add me on my LinkedIn, i’d be happy to connect!
Or send me an email: